Newsletter 1:2012
February 1, 2012
The year 2012 marks the 30th anniversary of the Collaborative Transplant Study.
Credit goes to all participants for their contribution to a priceless and invaluable resource
of transplant information. Much has been learned from our combined efforts during these 30
years and it is likely that more valuable research findings will be made during coming years.
The key feature of the CTS registry is its high quality, thanks to the excellent support by all of you.
Whereas 30 years ago the one-year graft survival rate was the accepted gauge for measuring
the success of transplantation, attention has focused on long-term outcomes in recent years.
CTS played a role in this development. As customary at the beginning of each year, we have updated
all 2581 website graphs to include the most recent experience and to show comparisons between results
obtained during early and more recent phases of this project. You are welcome to view the updated
website graphs under: www.ctstransplant.org. The new password is enclosed.
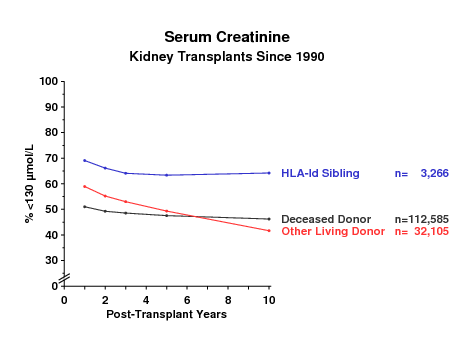
Figure 1
For the analysis of long-term outcomes, not only the graft survival rate but also the quality of graft
function as well as secondary outcome indicators are of interest. As an example, the evolution of serum
creatinine values as a reflection of graft function is shown for different categories of kidney
transplants in Figure 1. With 10 years of observation, the privileged category of transplants from
HLA-identical sibling donors clearly outperforms other categories. Approximately 15-20 % more of these
patients had a creatinine of <130 µmol/L throughout the follow up period. Whereas kidney function in
liver transplant recipients is strikingly better than that in deceased-donor kidney recipients, kidney
function in heart transplant recipients is very similar to that found in kidney recipients (Figure 2).
Whether these differences are simply a reflection of differences in immunosuppressive treatment with
potentially nephrotoxic drugs remains to be elucidated.
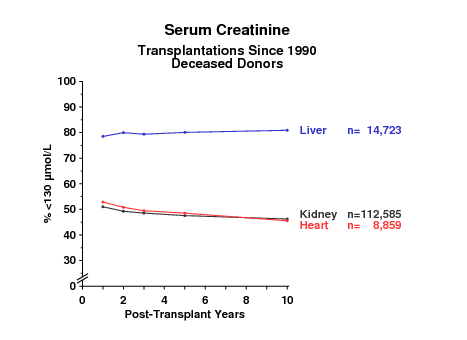
Figure 2
There are also interesting differences in the rates at which patients develop de-novo cataract or
osteoporosis. We studied patients for whom a negative status for cataract and osteoporosis was reported
at year one post-transplant. During the following 4 years, liver recipients showed the lowest, heart
recipients an intermediate, and deceased-donor kidney recipients the highest rate of cataract (Figure 3).
However, when significant evidence of osteoporosis was analyzed, heart recipients showed the highest rate
(Figure 4). While steroid treatment has been implicated as an important inducer of both diseases, the
discrepant results shown in Figures 3 and 4 suggest that it is not simply a question of steroid dose
whether a patient develops a cataract or osteoporosis.
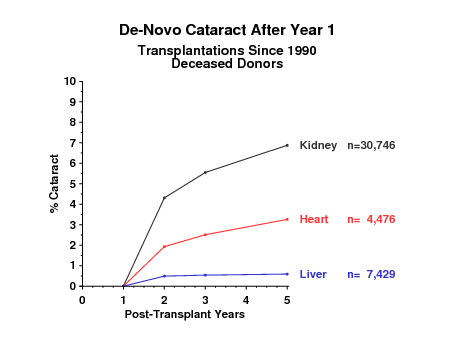
Figure 3
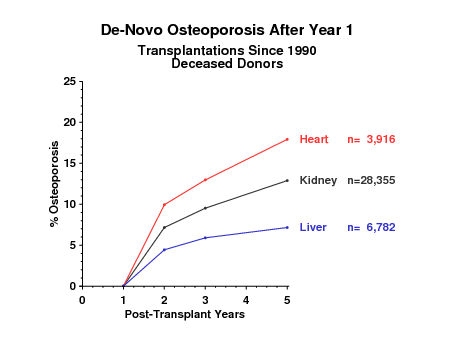
Figure 4
The results for de-novo cataract and osteoporosis in the different categories of kidney graft recipients
are depicted in Figures 5 and 6. Recipients of deceased-donor grafts show higher rates than recipients of
grafts from live donors.
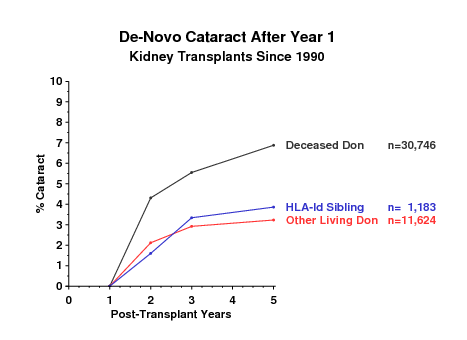
Figure 5
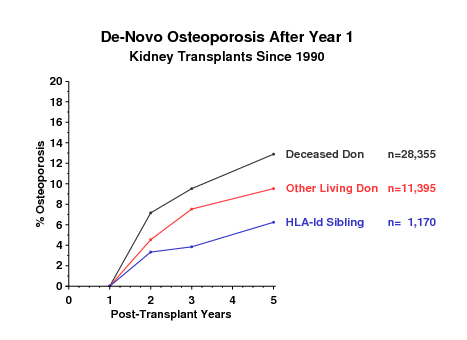
Figure 6
One might suspect that differences in recipient age might explain the differences shown in Figures 3 - 6.
However, we found that the answer is not as simple as that (Figures 7 and 8) and that further analysis
using sophisticated statistical techniques will be required for obtaining a better answer.
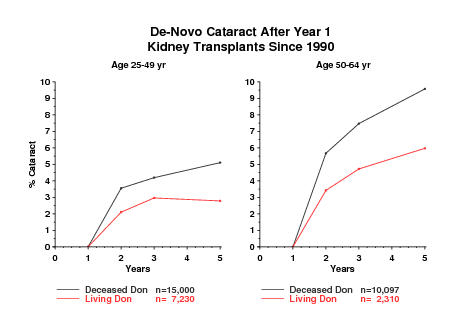
Figure 7
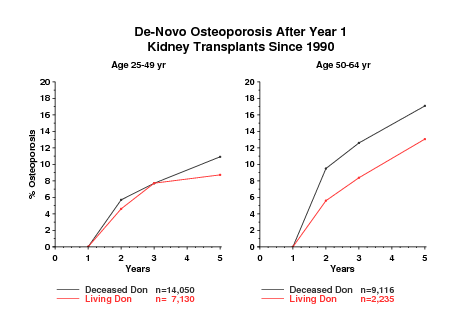
Figure 8
I would like to remind you that the next deadline for shipment of material for the CTS serum and DNA
projects is
May 21/22, 2012.
Please inform us per e-mail, fax or telephone of shipping details so that we may follow up from our end
in case shipments are delayed. Do not hesitate to contact us if you have any questions. Your support of
these studies is highly appreciated. Please be a part of this important initiative! It is not too late to
join.
Thank you for your continued cooperation.
With best wishes for a successful year 2012,
Gerhard Opelz