Figure 1
February 1, 2014
A few years ago, we reported how reducing the dosage of maintenance
immunosuppression after the first year post-transplant affected kidney graft survival in
patients with well-functioning grafts (Transplantation 2008; 86:371-376). Patients without
prior rejection and good serum creatinine levels at one year post-transplant in whom the
dosage of calcineurin inhibitors (CNI) was tapered during the second year to below a certain
threshold showed inferior subsequent graft survival. This suggests that underimmunosuppression
in patients with well-functioning grafts is associated with a significant
long-term risk of graft loss. A weakness of the report, however, was that we analyzed dosages
in mg/kg/day rather than blood trough levels. In the meantime, with your generous support,
we have been able to collect CNI trough levels and outcome data for thousands of patients.
During the last few years, the vast majority of kidney recipients reported to CTS were treated
with tacrolimus and our new analysis of one-year trough levels in relation to subsequent graft
survival is therefore based on tacrolimus-treated recipients.
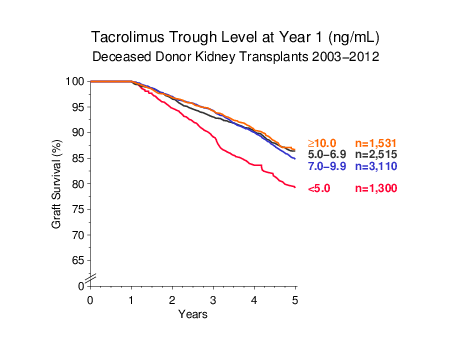
Figure 1 shows the relationship between tacrolimus trough level one year after
transplantation and subsequent graft survival to year 5. A one-year tacrolimus trough level
below 5 ng/mL was associated with statistically significantly inferior graft survival
(Ρ < 0.001 vs all other categories of exposure).
Figure 1
When the concomitant dose of MPA was taken into account (defined as low dose MPA ≤1.0 g MMF or ≤0.72 g EC-MPS; full dose MPA ≥1.5 g MMF or ≥1.08 g EC-MPS), low tacrolimus trough level of <5.0 ng/mL at one year resulted in strikingly lower graft survival only when combined with low-dose MPA. Patients who received full-dose MPA appeared to do well even when their tacrolimus through level was below 5 ng/mL (Figure 2).
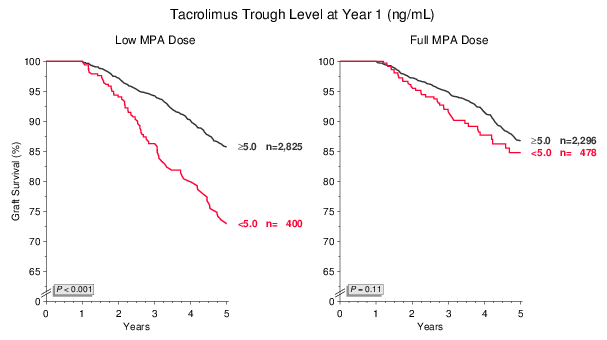
Figure 2
However, it would be wrong to conclude from the data shown in Figure 2 that low tacrolimus trough level combined with full-dose MPA provides equally effective immunosuppression to higher tacrolimus exposure levels. When the proportion of patients with serum creatinine <130 μmol/L were plotted, it became apparent that a low tacrolimus trough level is associated with a gradual decline in the proportion of patients who maintained excellent graft function to five years post-transplant.
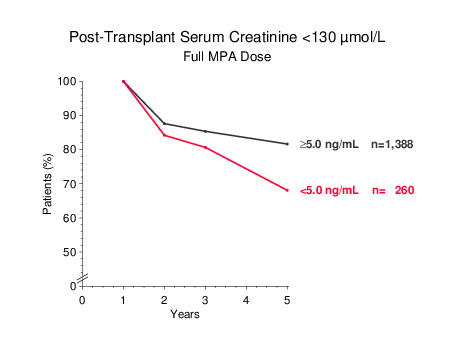
Figure 3
Moreover, when tacrolimus trough levels in patients on full-dose MPA were examined at years 2, 3 and 5, it became apparent that the mean trough level at five years in patients who started out at <5 ng/mL at one year had increased to nearly 7 ng/mL by year 5, and was now virtually identical to that of patients who had started out at ≥5 ng/mL. The most likely explanation for this finding is that clinical events mandated an increase of the tacrolimus dose during years 25 in patients who were on a low trough level of <5 ng/mL at year one (Figure 4).
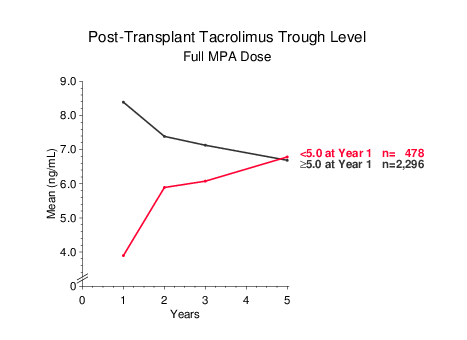
Figure 4
The inferior efficacy of a tacrolimus trough level <5 ng/mL was further supported by an analysis of patients who were maintained on stable trough levels of either <5 ng/mL or ≥5 ng/mL at years one and two, or whose trough level was lowered during year two from an initial ≥5 ng/mL to <5 ng/mL. Graft survival during years 35 clearly correlated with the 2-year tacrolimus trough level and was inferior in patients whose 2-year trough level was <5 ng/mL (Figure 5).
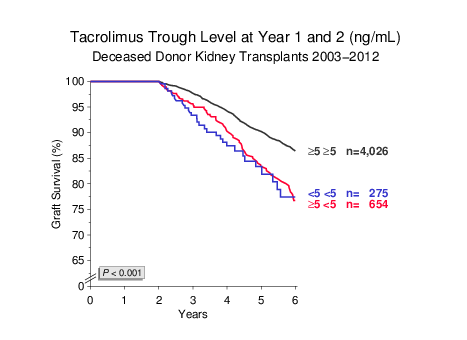
Figure 5
In addition, we were unable to find evidence to suggest that a low tacrolimus trough level (<5 ng/mL)
resulted in better long-term graft survival if patients had received antibody induction treatment (not shown).
Overall, these data indicate that the risk of under-immunosuppression during the maintenance phase is
substantial in kidney transplant patients. Maintenance tacrolimus trough levels higher than 5.06.9 ng/mL
were not found to be associated with superior graft survival (Figure 1). Whether such high trough levels
are associated with an increase in undesirable side effects requires further analysis.
We should like to point out that these findings would not have become known were it not for the
remarkable spirit of cooperation that is the hallmark of the CTS study. Your selfless voluntary
contribution to CTS makes it possible to investigate difficult questions based on large numbers of
patients, a feature that is unique in the transplant world and yields answers from meaningful
patient subgroups even when relatively infrequent events are concerned.
As has become customary at the start of each year, all transplant outcome graphs on the CTS website
have been updated. This will also affect the analysis of transplants at your own center performed
via the CTS website. You are welcome to use the CTS outcome graphs for teaching purposes or for
presentations at conferences. No special request is necessary.