Figure 1
CTS Collaborative Transplant Study
Dear Colleague
Because of continuing discussion concerning the impact of HLA matching on graft survival,
we are dedicating this newsletter to that topic. Su et al., who evaluated 33,433 deceased donor
kidney transplantations performed between 1994 and 1998 in the United States, reported in 2004
on a Diminishing Significance of HLA Matching in Kidney Transplantation (AJT 4: 1501, 2004).
Our subsequent analysis of CTS data disagreed with that viewpoint and instead provided evidence
in support of an inclusion of HLA matching in kidney allocation algorithms even in the future
(Opelz and Döhler, Transplantation 84: 137, 2007). A very recent analysis of the United States
UNOS data by Williams et al. also showed a continuing influence of HLA matching. These authors
found a 64 % higher risk of graft failure in 6 HLA-A+B+DR mismatch transplants as compared
to 0 mismatch grafts (Transplantation 100: 1094, 2016).
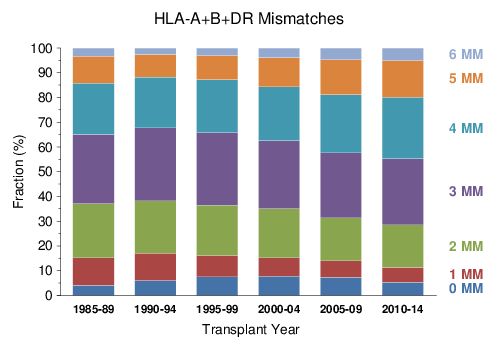
The distribution of HLA mismatches reported to CTS in patients who received a deceased donor kidney transplant during the last 30 years is depicted in Figure 1.
Figure 1
The percentage of patients who received poorly matched grafts with 56 HLA A+B+DR mismatches increased between 1990 and 2014 from 11.7 % to 19.9 %, whereas the percentage of patients with 01 mismatch grafts decreased from 17.1 % to 11.4 %.
In the article published in 2007, we compared the impact of HLA compatibility in two different decades and the results of this CTS publication are illustrated in Figure 2. The important finding was that, while overall graft survival strikingly improved from 19851994 to 19952004, the influence of HLA matching on graft survival remained almost the same with a mean hazard ratio of 1.07 calculated per mismatch in 19851994 and a very similar ratio of 1.06 in 19952004.
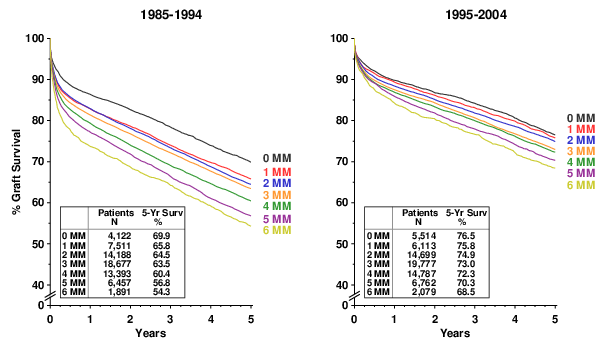
Figure 2
The results of an entirely independent new CTS analysis of the next 10-year period 20052014 are depicted in Figure 3. Although overall graft survival further improved from the previous decade, it is surprising that the difference in 5-year graft survival between the 0 and 6 mismatch groups increased from 8.0 % in 19952004 to 9.0% in 20052014. Multivariate Cox regression analysis, in which transplant number, transplant year, geographic origin (continent), recipient and donor age, sex and race, duration of pretransplant dialysis, original disease leading to end-stage renal failure, preformed panel-reactive lymphocytotoxic antibodies (PRA), cold ischemia time, allocation rules (old to old) and type of immunosuppressive treatment according to intention to treat (type of calcineurin inhibitor, anti-proliferatives, induction therapy) were considered as confounders, showed a mean hazard ratio of 1.07 per mismatch (95% confidence interval (CI) 1.051.08, P < 0.001). In other words, the hazard ratios per HLA mismatch were virtually identical in the three consecutive decades 19851994, 19952004 and 20052014. The hazard ratio comparing 0 and 6 mismatches in the 20052014 interval was 1.41, indicating that 41% more grafts were lost in recipients of 6 mismatch transplants within the first 5 years after transplantation. Importantly, HLA matching influenced graft outcome not only during the first year but also during the following 4 years, as shown by the finding that the survival half-life-time of well-matched grafts was 40 % better: 13.6 years in 6 mismatch transplants as compared to 19.0 years in 0 mismatch transplants.
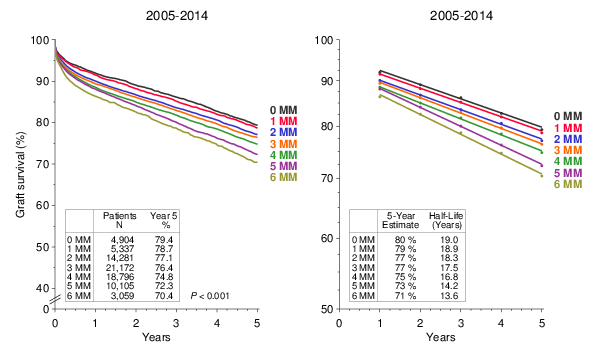
Figure 3
Likewise, the analysis of death censored graft and patient survival rates showed equally impressive effects of HLA matching on outcomes for the 20052014 period (Figure 4).
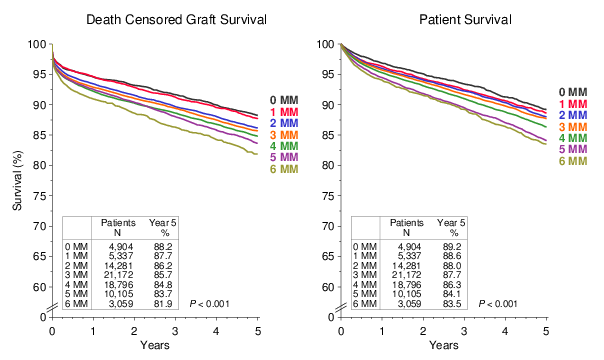
Figure 4
We observed a 71% increase in death censored graft failures from 0 to 6 HLA mismatches and Cox multivariate analysis showed a mean hazard ratio of 1.09 per HLA mismatch (95% CI 1.071.10, P < 0.001). The corresponding hazard ratio for patient survival was 1.04 (95% CI 1.031.06, P < 0.001).
A strong correlation was observed also between the number of HLA mismatches and the percentage of patients who required rejection treatment during the first post-transplant year (Figure5). Particularly impressive is the large difference between perfectly (0 HLA mismatches) and poorly (56 HLA mismatches) matched transplants. Multivariate logistic regression analysis showed a mean risk ratio of 1.09 per mismatch.
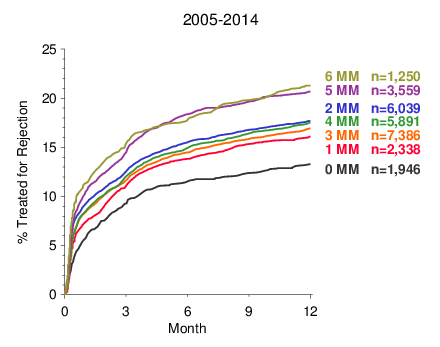
Figure 5
We would like to inform you about a new facility which can be utilized for the initial registration of transplantations with CTS.
Until now, you have been able to transfer your data to CTS in three different ways:
As an additional possibility, interactive forms in PDF format are now available on the CTS homepage for the initial registration of transplantations performed at your center. For using this new function, you must enter your center account, the one that you also use for the analysis of your own centers data. To open your account, you need a username which consists of a letter (k for kidney or pancreas, h for heart or lung, and l for liver) followed by the number assigned to your center (maximum 3 digits) and your centers password which consists of 9 digits (three lower case letters followed by three numbers and another three lower case letters). Your program director should already possess this access information; if it is not readily available, the program director can contact us by sending an email to support@ctstransplant.org . These interactive PDF forms can be accessed via the CTS homepage www.ctstransplant.org → Download/Forms → Electronic Forms. Please do not forget to click on the green SUBMIT button at the bottom which will finalize the data submission via a secured link to the CTS database.
As at the beginning of each year, all outcome graphs on the CTS homepage have been updated. You can access the new graphs either using the CTS password attached to this newsletter or via your center-specific access account. You are welcome to use the CTS graphs in your presentations or for teaching purposes without special request. Please check the CTS citation policy under the link http://www.ctstransplant.org/public/policy.shtml if you wish to include CTS graphs in publications.
We are entering the 35th year of CTS collaboration. On behalf of the entire CTS team I would like to express to each one of you my sincere gratitude for your continued and selfless support. We on our side are continuing our efforts to provide to you the results of independent transplant analyses that in many cases can be conducted only using the invaluable dataset of the CTS study.
The next shipping date for the DNA and serum studies is June 19/20, 2017.
We wish you a peaceful year 2017!
Yours sincerely,
![]()
Caner Süsal