Sample Graphs
We currently provide a set of 28 freely accessible graphs based on an analysis of CTS data. Click on graph to show larger image.
Kidney
Number of Transplant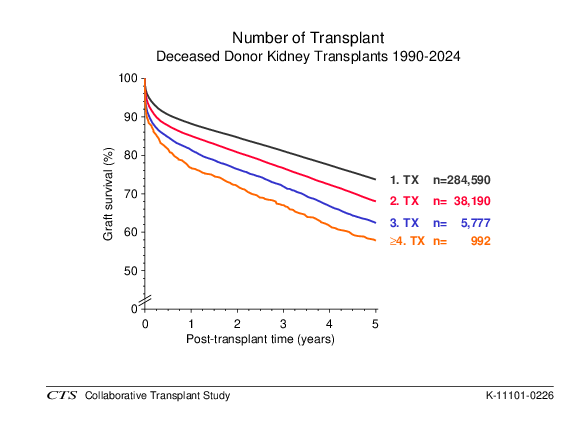 Graft Survival |
Number of Transplant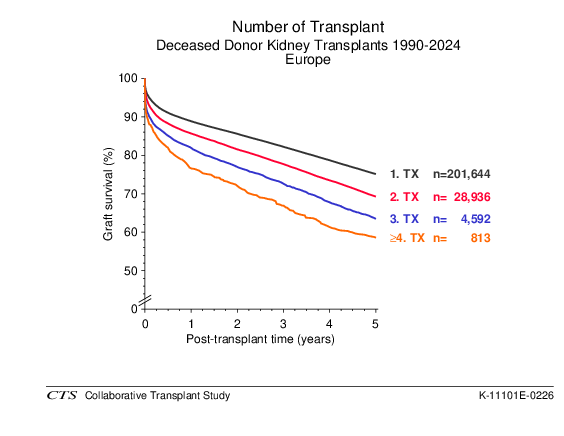 Graft Survival, Europe |
Relationship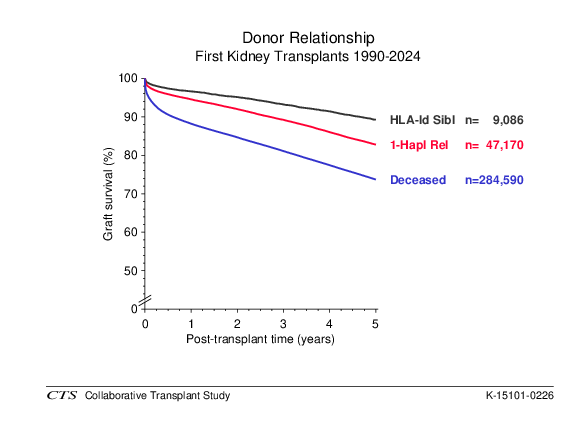 Graft Survival |
Relationship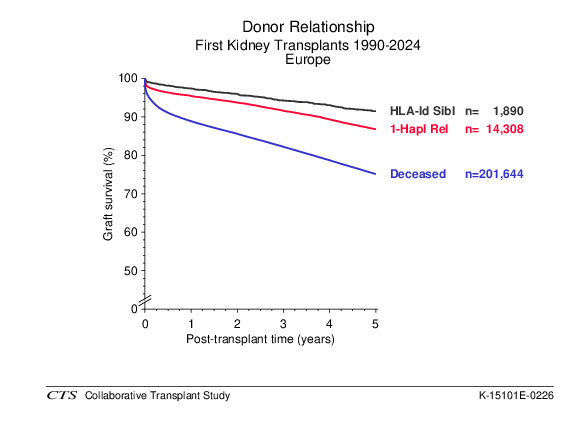 Graft Survival, Europe |
Relationship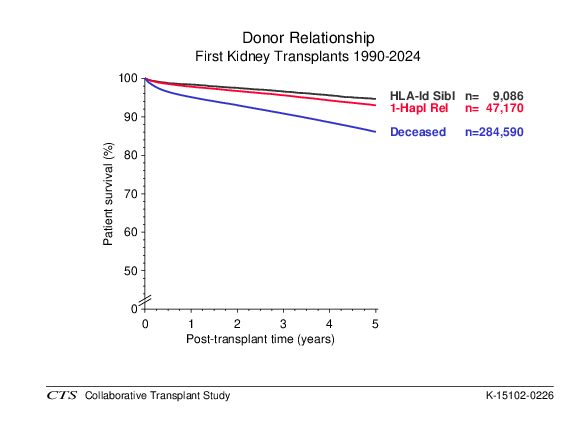 Patient Survival |
Relationship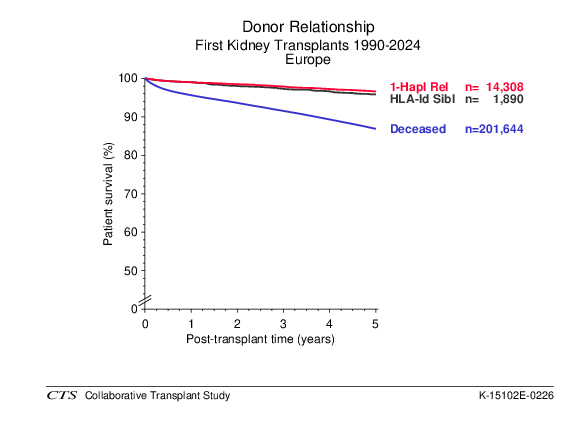 Patient Survival, Europe |
Relationship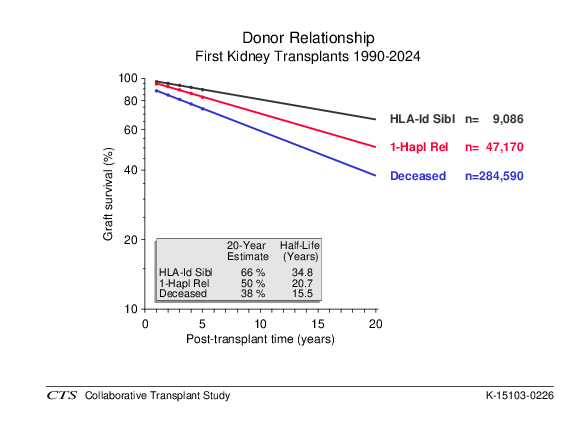 Graft Half Life |
Relationship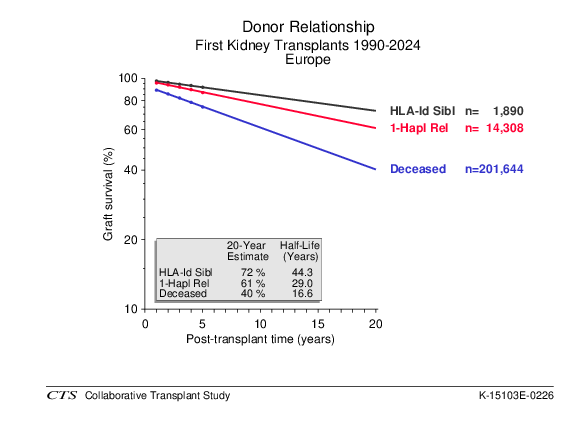 Graft Half Life, Europe |
Relationship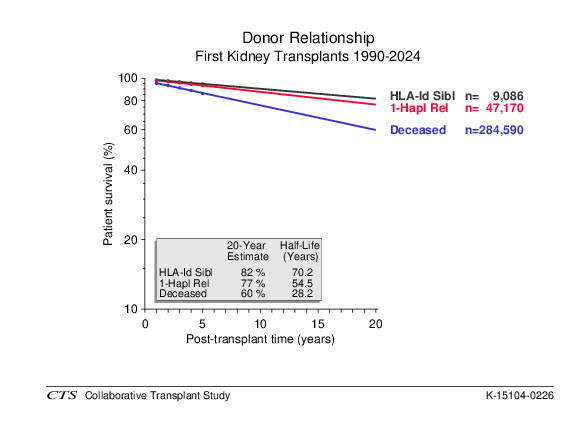 Patient Half Life |
Relationship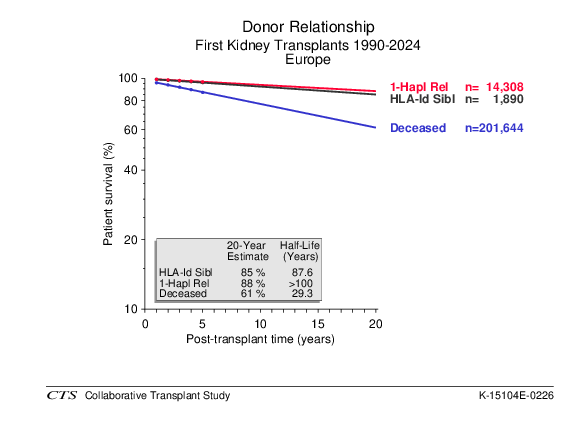 Patient Half Life, Europe |
Relationship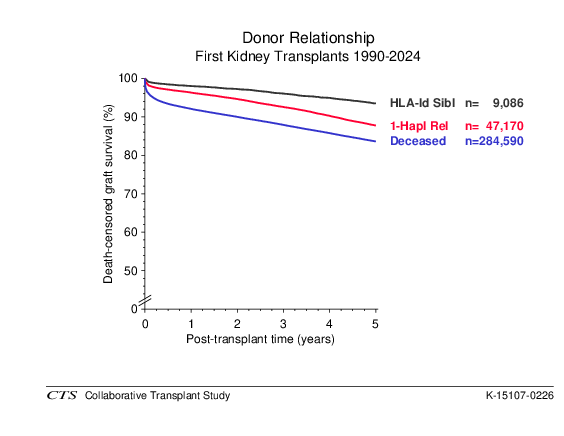 Functional Survival |
Relationship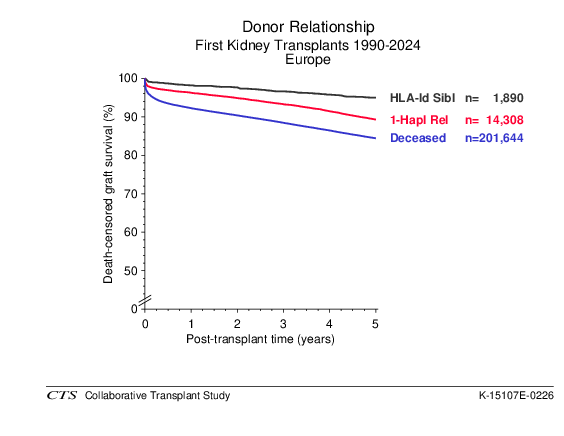 Functional Survival, Europe |
Relationship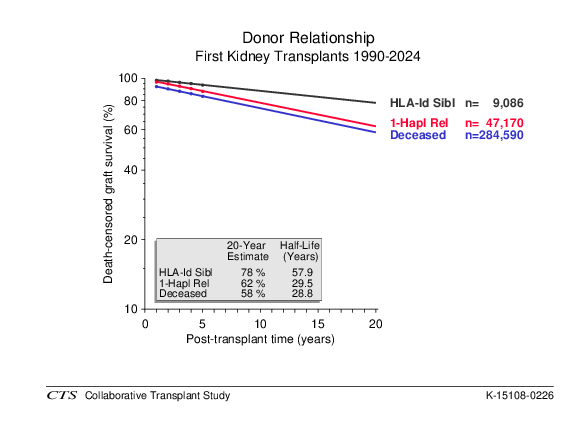 Functional Half Life |
Relationship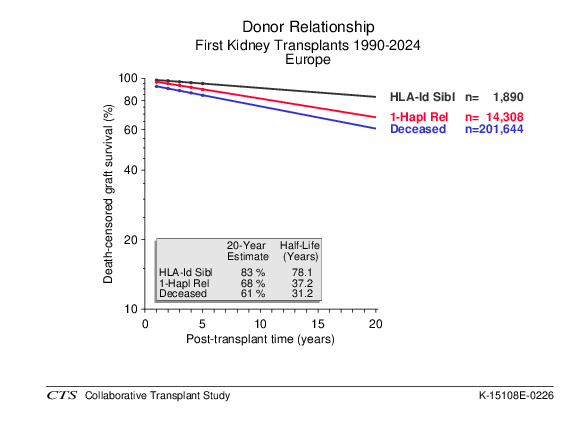 Functional Half Life, Europe |
1-Year Rejection Treatment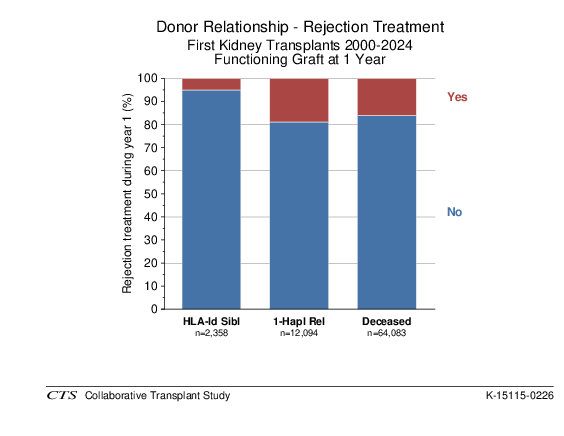 Bar Diagram |
1-Year Rejection Treatment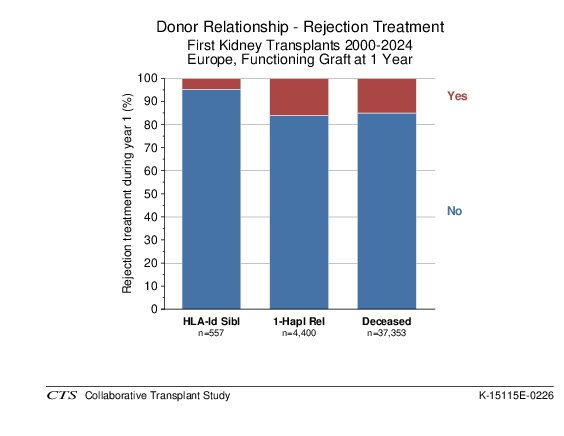 Bar Diagram, Europe |
HLA-A+B+DR Mismatches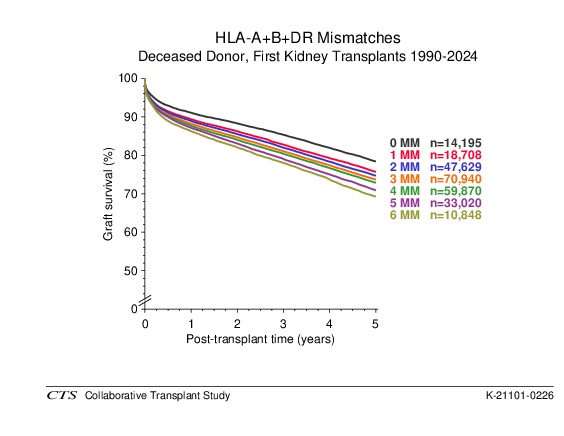 Graft Survival |
HLA-A+B+DR Mismatches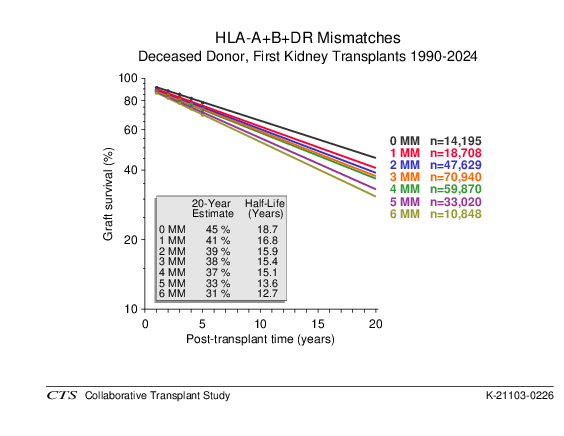 Graft Half Life |
Liver
Number of Transplant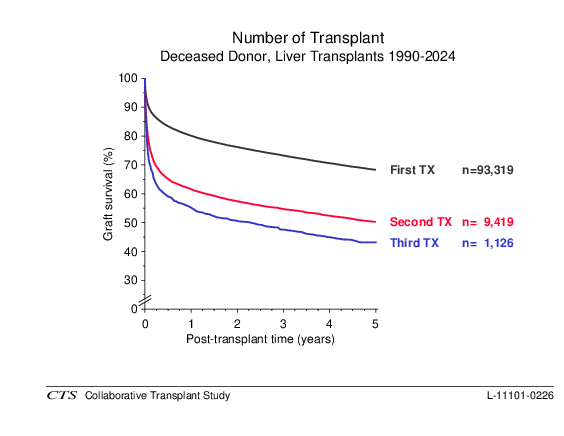 Graft Survival |
Number of Transplant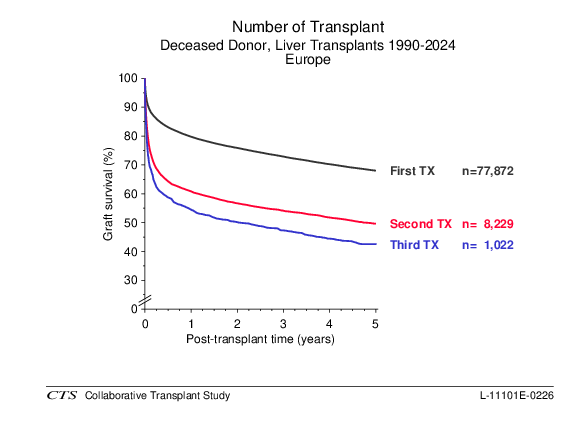 Graft Survival, Europe |
Original Disease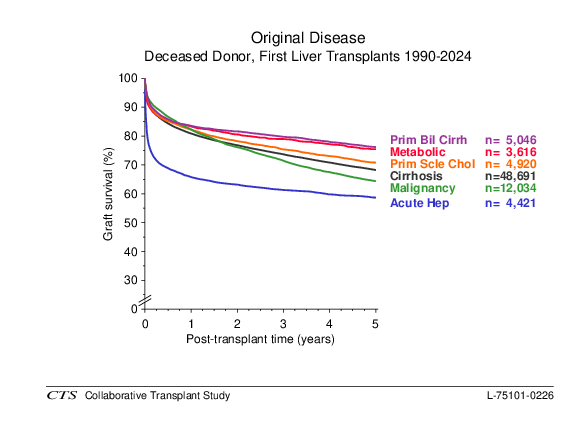 Graft Survival |
Original Disease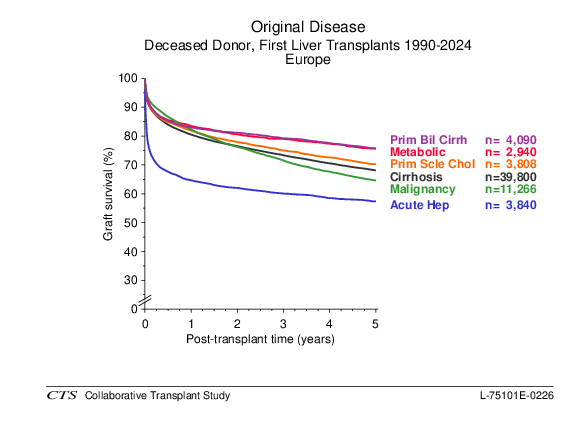 Graft Survival, Europe |
Heart, Heart-Lung, Lung
Number of Transplant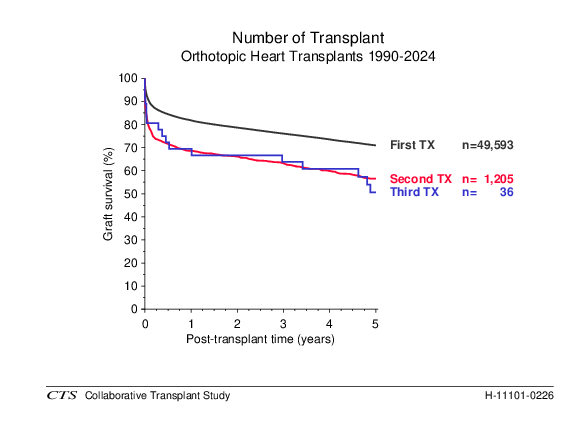 Graft Survival |
Number of Transplant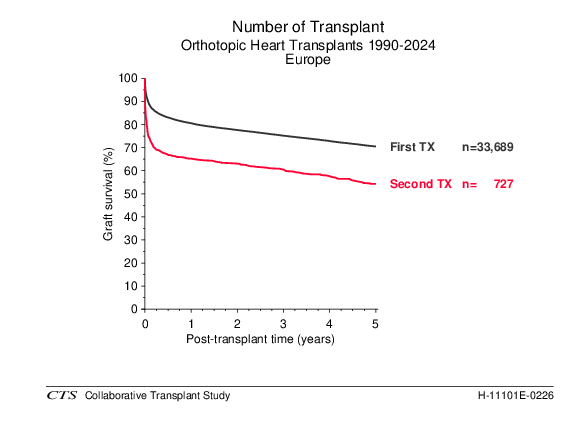 Graft Survival, Europe |
Original Disease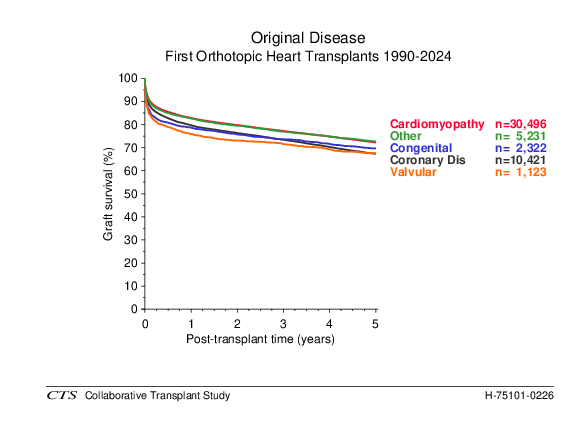 Graft Survival |
Original Disease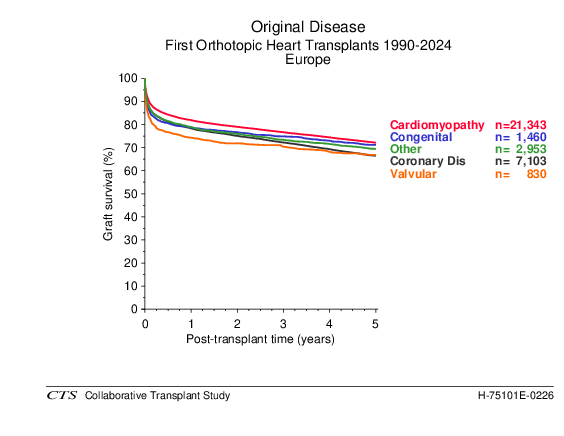 Graft Survival, Europe |
Pancreas
Number of Transplant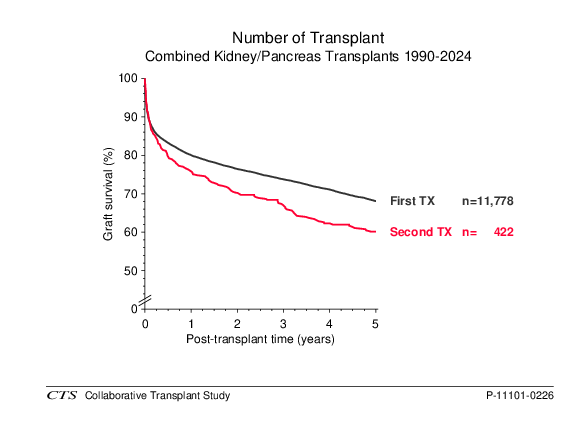 Graft Survival |
Number of Transplant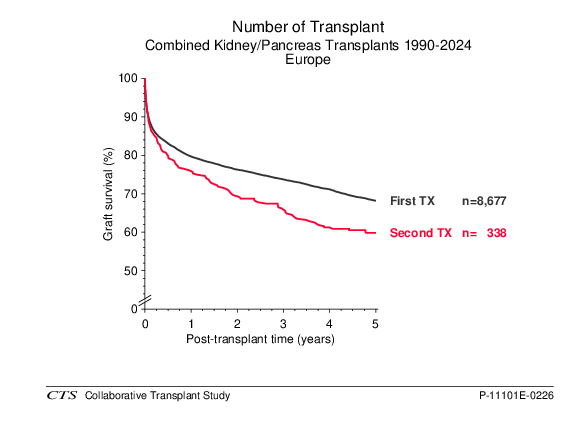 Graft Survival, Europe |